Pour ajouter weeks/textual
données sous les colonnes, vous devez ajouter le fichier de catégories de la bibliothèque jquery.flot.categories.min.js à vos ressources javascript.
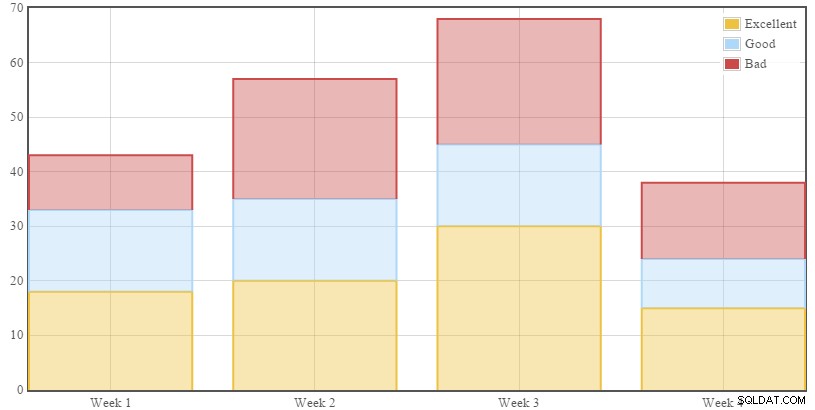
Si je vous comprends bien, vous voulez que le graphique ressemble à ceci
Javascript
Vous devez ajouter ces fichiers dans
<script src="//ajax.googleapis.com/ajax/libs/jquery/1.11.1/jquery.min.js"></script>
<script src="jquery.flot.min.js"></script>
<script src="jquery.flot.categories.min.js"></script>
<script src="jquery.flot.stack.min.js"></script>
et initialiser la bibliothèque nous parlerons de $output après ce code
<div id="placeholder" style="width:818px;height:413px" ></div>
<script type="text/javascript">
$(function() {
    var series = [<?php echo $output; ?>];
       $.plot("#placeholder", series, {
        series: {
            stack:true,
            lines:{fill:true,show:false,steps:false},
            bars: {
                show: true,
                barWidth: 0.8,
                align: "middle",
            },
        },
        xaxis: {
            mode: "categories",
            minTickSize: 1
        }
       });
});
PHP
Vous devez d'abord interroger la base de données pour trouver la date entre les dates spécifiées, après avoir obtenu le résultat, vous devez trier les données pour chaque semaine dans un tableau
Par exemple week One => 'good','good','bad','bad', 'week two' => and so on ...
après cela, vous pouvez utiliser array_count_values()
pour compter le nombre d'occurrences et construire la colonne des graphiques.
J'ai simplifié le code en utilisant des functions pour vous faciliter la tâche
<?php
$con = mysqli_connect("localhost", 'root','','your db');

function getChartData($con, $startDate, $endDate){

    $startDate = date("Y-m-d H:i:s", strtotime($startDate));
    $endDate = date("Y-m-d H:i:s", strtotime($endDate));

    $query = "SELECT * FROM `employees` WHERE `date` BETWEEN '$startDate' AND '$endDate'";

    $result = mysqli_query($con, $query) or die ("Error: ".mysqli_error($con));

    // a multidimenional array containing each week with it's
    $weeksData = [];

    // Group each week with it's data
    while($row = mysqli_fetch_array($result)){
        $weekNumber = date("W", strtotime($row['date']));
        if(isset($weeksData[$weekNumber]))
        {
            $weeksData[$weekNumber][] = $row['level'];
        }
        $weeksData[$weekNumber][] = $row['level'];
    }

    // reset array indexes and sort the array
    sort($weeksData);

    $data = array();

    // using array_count_values to count the number of (good, bad and excellent)
    foreach ($weeksData as $key => $week) {
        $data[$key] = array_count_values($week);
    }

    // return all the weeks with number of (good, bad and excellent) occurences
    return $data;
}

// build the javascript object {data:['week num', occuerences]}
function buildColumn($data,$label, $numberOfWeeks)
{
    $data = array_column($data,strtolower($label));
    $balance = $numberOfWeeks - count($data);
    if($balance !=0){
        for($i=1;$i<=$balance;$i++) {
            $data[] = 1;
        }
    }

    $string = '{data: [';
    foreach ($data as $key => $value) {
        $weekNumber = $key+1;
        $string .= '["Week '.$weekNumber.'",'.$value.'],';
    }
    $string = rtrim($string, ',');
    $string .= "],valueLabels: {show: true,valign: 'middle'},label: '$label'}";
    return $string;
}

function getNumberofWeeks($startDate, $endDate){
      $weeks = array();
      $period = new DatePeriod(new DateTime($startDate),
        DateInterval::createFromDateString('+1 day'),new DateTime($endDate)
      );
      foreach ( $period as $dt ) {
        $weeks[] = $dt->format( 'W' );
      }
      return count(array_unique($weeks));
}
maintenant vous pouvez facilement utiliser ces fonctions comme ceci
$numberOfWeeks = getNumberofWeeks($_POST['start'],$_POST['end']);

// get data of the last number of weeks
$chartData = getChartData($con, $_POST['start'],$_POST['end']);
// bulding columns data for each occurence
$badColumn = buildColumn($chartData,'Bad', $numberOfWeeks);
$goodColumn = buildColumn($chartData,'Good', $numberOfWeeks);
$excellentColumn = buildColumn($chartData,'Excellent', $numberOfWeeks);

// output {data: ...}, {data: ...},{data:....}
$output = "$excellentColumn , $goodColumn , $badColumn";
Exemple de travail complet
<!DOCTYPE html>
<html>
<head>
    <title></title>
    <script src="//ajax.googleapis.com/ajax/libs/jquery/1.11.1/jquery.min.js"></script>
    <script src="jquery.flot.min.js"></script>
    <script src="jquery.flot.categories.min.js"></script>
    <script src="jquery.flot.stack.min.js"></script>
</head>
<body>
<?php
$con = mysqli_connect("localhost", 'root','','your db');

function getChartData($con, $startDate, $endDate){

    $startDate = date("Y-m-d H:i:s", strtotime($startDate));
    $endDate = date("Y-m-d H:i:s", strtotime($endDate));

    $query = "SELECT * FROM `employees` WHERE `date` BETWEEN '$startDate' AND '$endDate'";

    $result = mysqli_query($con, $query) or die ("Error: ".mysqli_error($con));

    // a multidimenional array containing each week with it's
    $weeksData = [];

    // Group each week with it's data
    while($row = mysqli_fetch_array($result)){
        $weekNumber = date("W", strtotime($row['date']));
        if(isset($weeksData[$weekNumber]))
        {
            $weeksData[$weekNumber][] = $row['level'];
        }
        $weeksData[$weekNumber][] = $row['level'];
    }

    // reset array indexes and sort the array
    sort($weeksData);

    $data = array();

    // using array_count_values to count the number of (good, bad and excellent)
    foreach ($weeksData as $key => $week) {
        $data[$key] = array_count_values($week);
    }

    // return all the weeks with number of (good, bad and excellent) occurences
    return $data;
}

// build the javascript object {data:['week num', occuerences]}
function buildColumn($data,$label, $numberOfWeeks)
{
    $data = array_column($data,strtolower($label));
    $balance = $numberOfWeeks - count($data);
    if($balance !=0){
        for($i=1;$i<=$balance;$i++) {
            $data[] = 1;
        }
    }

    $string = '{data: [';
    foreach ($data as $key => $value) {
        $weekNumber = $key+1;
        $string .= '["Week '.$weekNumber.'",'.$value.'],';
    }
    $string = rtrim($string, ',');
    $string .= "],valueLabels: {show: true,valign: 'middle'},label: '$label'}";
    return $string;
}

function getNumberofWeeks($startDate, $endDate){
      $weeks = array();
      $period = new DatePeriod(new DateTime($startDate),
        DateInterval::createFromDateString('+1 day'),new DateTime($endDate)
      );
      foreach ( $period as $dt ) {
        $weeks[] = $dt->format( 'W' );
      }
      return count(array_unique($weeks));
}
// the number of weeks that you want to display in the chart
$numberOfWeeks = getNumberofWeeks($_POST['start'],$_POST['end']);

// get data of the last number of weeks
$chartData = getChartData($con, $_POST['start'],$_POST['end']);
// bulding columns data for each occurence
$badColumn = buildColumn($chartData,'Bad', $numberOfWeeks);
$goodColumn = buildColumn($chartData,'Good', $numberOfWeeks);
$excellentColumn = buildColumn($chartData,'Excellent', $numberOfWeeks);

// output {data: ...}, {data: ...},{data:....}
$output = "$excellentColumn , $goodColumn , $badColumn";

?>
<div id="placeholder" style="width:818px;height:413px" ></div>
<script type="text/javascript">
$(function() {
    var series = [<?php echo $output; ?>];
       $.plot("#placeholder", series, {
        series: {
            stack:true,
            lines:{fill:true,show:false,steps:false},
            bars: {
                show: true,
                barWidth: 0.8,
                align: "middle",
            },
        },
        xaxis: {
            mode: "categories",
            minTickSize: 1
        }
       });
});
  </script>
 </body>
</html>
Modifier
Il suffit de remplacer ces deux fonctions pour le rendre compatible avec dd/mm/yyyy
 function getChartData($con, $startDate, $endDate){
    $startDate = explode('/', $startDate);
    $startDate = $startDate[1] . '/' . $startDate[0] . '/' . $startDate[2];

    $endDate = explode('/', $endDate);
    $endDate = $endDate[1] . '/' . $endDate[0] . '/' . $endDate[2];

    $startDate = date("Y-m-d H:i:s", strtotime($startDate));
    $endDate = date("Y-m-d H:i:s", strtotime($endDate));

    $query = "SELECT * FROM `employees` WHERE `date` BETWEEN '$startDate' AND '$endDate'";

    $result = mysqli_query($con, $query) or die ("Error: ".mysqli_error($con));

    // a multidimenional array containing each week with it's
    $weeksData = [];

    // Group each week with it's data
    while($row = mysqli_fetch_array($result)){
        $weekNumber = date("W", strtotime($row['date']));
        if(isset($weeksData[$weekNumber]))
        {
            $weeksData[$weekNumber][] = $row['level'];
        }
        $weeksData[$weekNumber][] = $row['level'];
    }

    // reset array indexes and sort the array
    sort($weeksData);

    $data = array();

    // using array_count_values to count the number of (good, bad and excellent)
    foreach ($weeksData as $key => $week) {
        $data[$key] = array_count_values($week);
    }

    // return all the weeks with number of (good, bad and excellent) occurences
    return $data;
}
et
   function getNumberofWeeks($startDate, $endDate){
    $startDate = explode('/', $startDate);
    $startDate = $startDate[1] . '/' . $startDate[0] . '/' . $startDate[2];

    $endDate = explode('/', $endDate);
    $endDate = $endDate[1] . '/' . $endDate[0] . '/' . $endDate[2];
    $diff = strtotime($startDate, 0) - strtotime($endDate, 0);

    return str_replace('-','', (int)floor($diff / 604800));
}