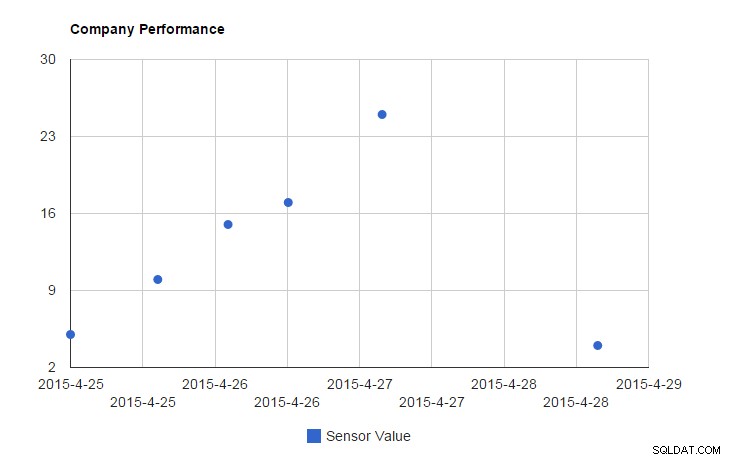
Je viens d'essayer le code suivant :
<?php
 $rows = array();
  $table = array();
  $table['cols'] = array(

    // Labels for your chart, these represent the column titles.

    array('label' => 'Date Time', 'type' => 'date'),
    array('label' => 'Sensor Value', 'type' => 'number'),
    array('type' => 'string', 'role' => 'tooltip', 'p' => array('html' => 'true')),
);

$result = array(
    array('datetime' => '2015-04-25 00:00:00', 'sensorValue' => 5),
    array('datetime' => '2015-04-25 14:30:00', 'sensorValue' => 10),
    array('datetime' => '2015-04-26 02:10:10', 'sensorValue' => 15),
    array('datetime' => '2015-04-26 12:10:10', 'sensorValue' => 17),
    array('datetime' => '2015-04-27 03:45:23', 'sensorValue' => 25),
    array('datetime' => '2015-04-28 15:34:00', 'sensorValue' => 4),
);

    /* Extract the information from $result */
    foreach($result as $r) {

      $temp = array();

      // The following line will be used to slice the chart

      $temp[] = array('v' => 'Date('.date('Y',strtotime($r['datetime'])).',' .
                                     (date('n',strtotime($r['datetime'])) - 1).','.
                                     date('d',strtotime($r['datetime'])).','.
                                     date('H',strtotime($r['datetime'])).','.
                                     date('i',strtotime($r['datetime'])).','.
                                     date('s',strtotime($r['datetime'])).')');

      // Values of the each slice

      $temp[] = array('v' => (int) $r['sensorValue']);
      $temp[] = array('v' => 'This is a <b>custom</b> tooltip. Insert your data as you like: On the 25th of April, 2015 the sensor value was: <b>5</b>');
      $rows[] = array('c' => $temp);
    }

$table['rows'] = $rows;
// convert data into JSON format
$jsonTable = json_encode($table);
?>


  <html>
  <head>
    <script type="text/javascript"
          src="https://www.google.com/jsapi?autoload={
            'modules':[{
              'name':'visualization',
              'version':'1',
              'packages':['corechart']
            }]
          }"></script>

    <script type="text/javascript">
      google.setOnLoadCallback(drawChart);

      function drawChart() {
        var data = new google.visualization.DataTable(<?php echo $jsonTable; ?>);

        var options = {
          title: 'Company Performance',
          curveType: 'function',
          legend: { position: 'bottom' },
          tooltip: {isHtml: true}
        };

        var chart = new google.visualization.ScatterChart(document.getElementById('curve_chart'));

        chart.draw(data, options);
      }
    </script>
  </head>
  <body>
    <div id="curve_chart" style="width: 900px; height: 500px"></div>
  </body>
</html>
donc j'ai changé :
array('label' => 'Date Time', 'type' => 'number')versarray('label' => 'Date Time', 'type' => 'date')- a formé la date avec
'Date(date("Y"),date("n") - 1,date("d"),0,0,0)'comme décrit ici
Voici le résultat avec html dans l'infobulle :
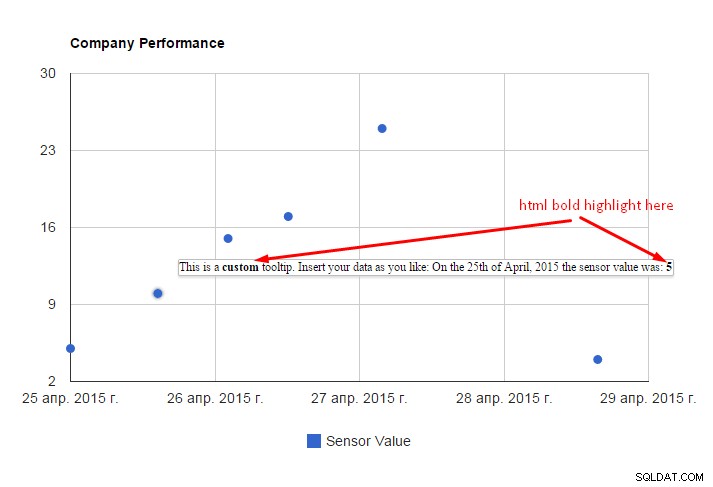
MISE À JOUR
Si vous souhaitez des info-bulles personnalisées, ici est la doc pour ça. Voir le code mis à jour ci-dessus, vous devez apporter trois modifications pour personnaliser les info-bulles :
-
ajouter la colonne "virtuelle" à la liste des colonnes (avec role =tooltip) :
array('type' => 'string', 'role' => 'tooltip', 'p' => array('html' => 'true')), -
ajoutez la valeur de la colonne dans la boucle :
$temp[] = array('v' => 'This is a <b>custom</b> tooltip. Insert your data as you like: On the 25th of April, 2015 the sensor value was: <b>5</b>'); -
et faites savoir à jsapi que le contenu est html :
var options = {
  ...
  tooltip: {isHtml: true}
};
MISE À JOUR
Afin de personnaliser les valeurs de l'axe horizontal, vous devez consulter ceci première. Ajoutez simplement hAxis objet (et son format ) à l'objet options de graphique :
    var options = {
      ...
      hAxis: {
        format: 'yyyy-M-d'
      }
    };
et vous verrez quelque chose comme :